Jupiter’s Great Red Spot in 3D

Great Red Spot

It’s been a while since the last post, but this was worth it.

Sometimes, our infinite quest to discover…well, everything…brings us material that is both fascinating and interesting for everyone.
This usually means images instead of numbers, but this time we’re talking about 3D CG awesomeness!

Our casting for the day features Jupiter and Juno, the dynamic duo that certainly doesn’t fear the spotlight.
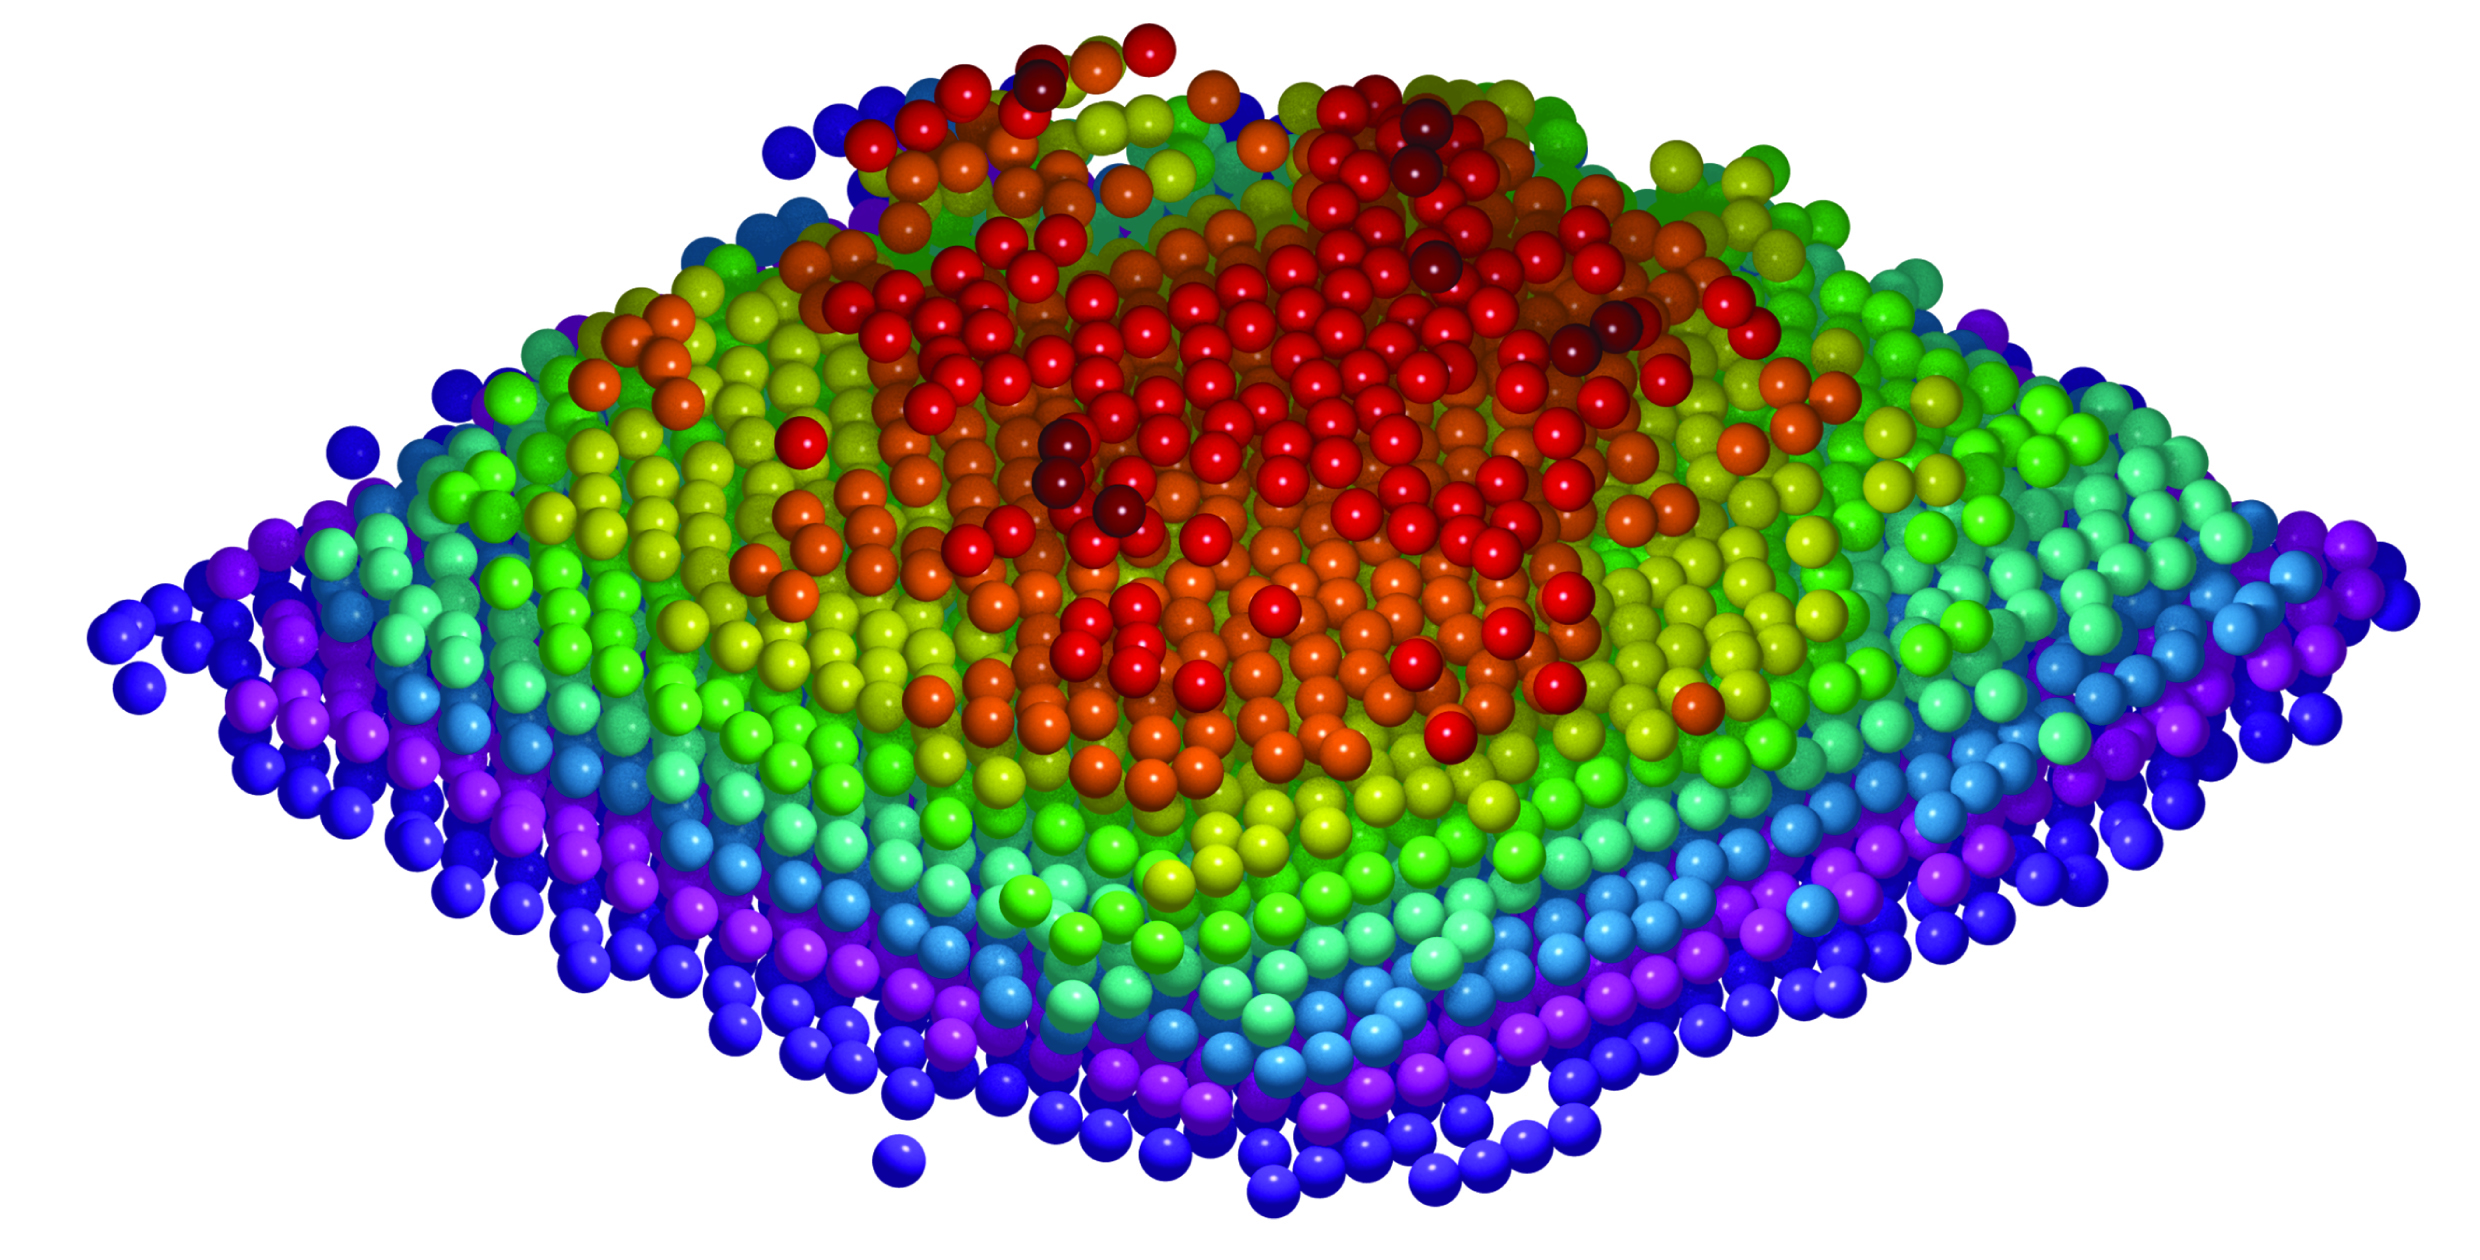
Their performance? A deep dive into Jupiter’s Great Red Spot, to discover what lies underneath the cloud tops.

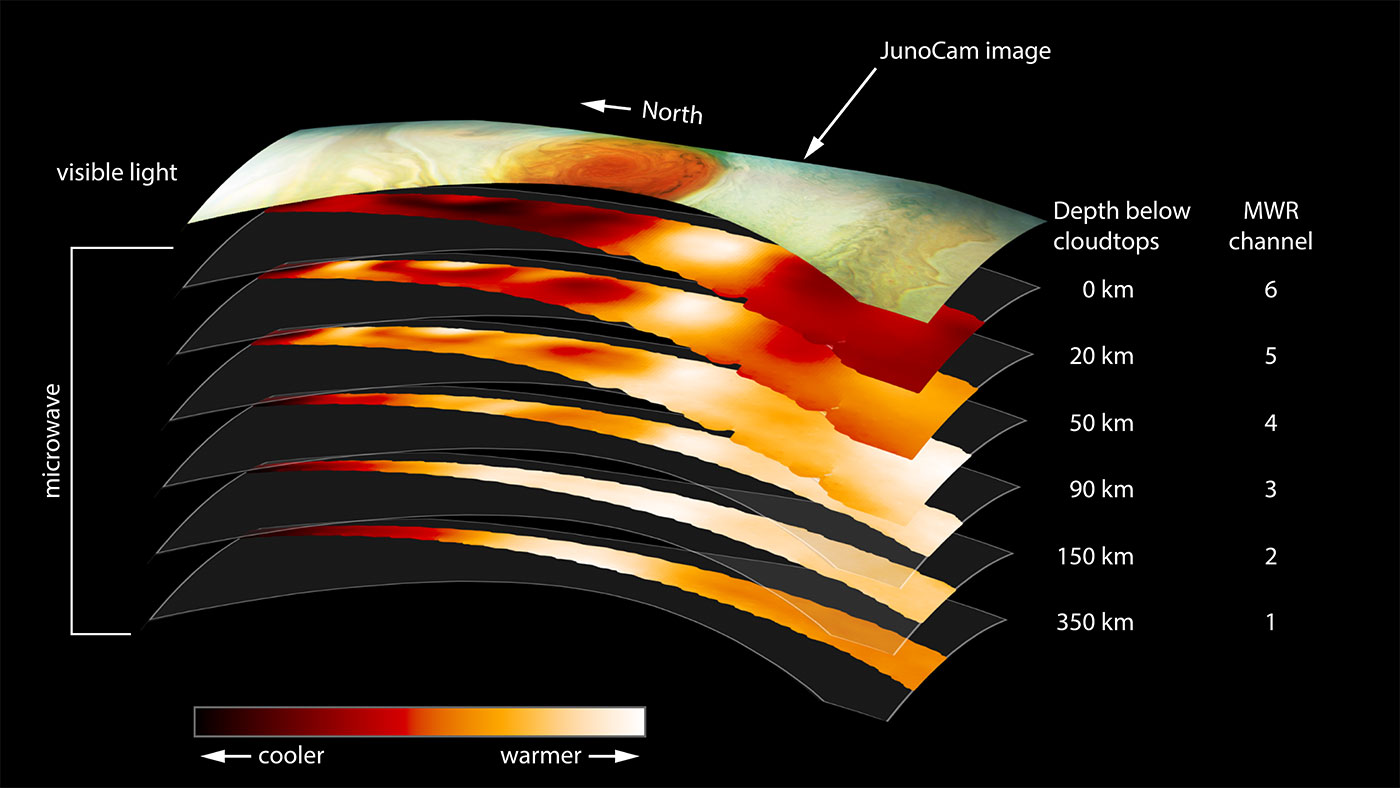
“The solar system’s most famous storm is almost one-and-a-half Earths wide, and has roots that penetrate about 200 miles (300 kilometers) into the planet’s atmosphere. Juno found that the Great Red Spot’s roots go 50 to 100 times deeper than Earth’s oceans and are warmer at the base than they are at the top”

Great Red Spot
Jupiter’s Great Red Spot

Data was gathered by Juno’s Microwave Radiometer (MWR), which is able to “look” through Jupiter’s clouds by analyzing different lengths of microwaves.

Great Red Spot Layers
Great Red Spot data from Juno’s MWR

However, we still don’t know what the future of the Great Red Spot will be. While it may have existed for more than 350 years, it has been shrinking quite rapidly.
And as always, thanks NASA!

Source: NASA

Disney Research gives a boost to fabrics rendering

Smoothed Aggregation Multigrid for Cloth Simulation

Disney Research found a different mathematical approach to solve the extremely complex equations necessary to render realistic fabrics.

As you can see from the video released with the official paper, the resulting simulation is extremely accurate. Like almost every algorithm, it’s not a generic solution to every cloth rendering problem. It performs better on large problems (more than 25k vertices), stiffer materials and small masses. Also, as stated by the authors, time to solution doesn’t really scale linearly, but there’s room for improvement.

Anyway, it’s a great addition to the 3D rendering algoritms’ world.


UCLA physicists map atoms in 3D

Have you ever tried those magical pieces of software that merge multiple pictures of an object from different angles to produce a 3D model of it?

Good. Now think about upgrading your equipment, because those guys at UCLA do the same with atoms. Seriously.

Using a scanning transmission electron microscope at the Lawrence Berkeley National Laboratory’s Molecular Foundry, Miao and his colleagues analyzed a small piece of tungsten, an element used in incandescent light bulbs. As the sample was tilted 62 times, the researchers were able to slowly assemble a 3-D model of 3,769 atoms in the tip of the tungsten sample.

Here’s the final result

The 3-D coordinates of thousands of individual atoms and a point defect in a material were determined with a precision of 19 trillionths of a meter, where the crystallinity of the material is not assumed. The figure shows the measured 3-D atomic positions of a tungsten tip, consisting of nine atomic layers, labelled with crimson (dark red), red, orange, yellow, green, cyan, blue, magenta and purple from layers one (top) to nine (bottom), respectively.


Original article here.